
- Mr. Vikram Mehta
- [email protected]
- +91 9619291512
-


Chemical Composition of Stainless Steel
Engineering reference chart of chemical composition in weight % — 27 stainless steel grades across carbon, manganese, phosphorus, sulfur, silicon, chromium, nickel and other elements.
Find a Grade
Pick a stainless steel grade to read its chemistry element by element, or filter the full reference chart below.
| Grade | C | Mn | P | S | Si | Cr | Ni | Others |
|---|---|---|---|---|---|---|---|---|
| 201 | 0.15 | 5.50 - 7.5 | 0.060 | 0.030 | 1.00 | 16.0 - 18.0 | 3.5 - 5.5 | N 0.25 |
| 202 | 0.15 | 7.5 - 10.0 | 0.060 | 0.030 | 1.00 | 17.0 - 19.0 | 4.0 - 6.0 | N 0.25 |
| 301 | 0.15 | 2.00 | 0.045 | 0.030 | 1.00 | 16.0 - 18.0 | 6.0 - 8.0 | N 0.25 |
| 302 | 0.15 | 2.00 | 0.045 | 0.030 | 0.75 | 17.0 - 19.0 | 8.0 - 10.0 | N ~0.10 |
| 304 | 0.08 | 2.00 | 0.045 | 0.030 | 0.75 | 18.0 - 20.0 | 8.0 - 10.5 | N 0.25 |
| 304L | 0.03 | 2.00 | 0.045 | 0.030 | 0.75 | 18.0 - 20.0 | 8.0 - 12.0 | N 0.25 |
| 304H | 0.04 - 0.10 | 2.00 | 0.045 | 0.030 | 0.75 | 18.0 - 20.0 | 8.0 - 10.5 | — |
| 305 | 0.12 | 2.00 | 0.045 | 0.030 | 0.75 | — | — | — |
| 309S | 0.08 | 2.00 | 0.045 | 0.030 | 0.75 | 22.0 - 24.0 | 12.0 - 15.0 | — |
| 310S | 0.08 | 2.00 | 0.045 | 0.030 | 1.50 | 24.0 - 26.0 | 19.0 - 22.0 | — |
| 310H | 0.04 - 0.10 | 2.00 | 0.045 | 0.030 | 0.75 | 24.0 - 26.0 | 19.0 - 22.0 | — |
| 316 | 0.08 | 2.00 | 0.045 | 0.030 | 0.75 | 16.0 - 18.0 | 10.0 - 14.0 | Mo 2.0-3.0, N 0.10 |
| 316L | 0.03 | 2.00 | 0.045 | 0.030 | 0.75 | 16.0 - 18.0 | 10.0 - 14.0 | Mo 2.0-3.0, N 0.10 |
| 316H | 0.04 - 0.10 | 2.00 | 0.045 | 0.030 | 0.75 | 16.0 - 18.0 | 10.0 - 14.0 | — |
| 316Ti | 0.08 | 2.00 | 0.045 | 0.030 | 0.75 | 16.0 - 18.0 | 10.0 - 14.0 | N 0.10, Ti 5(C+N) Min, 0.70 Max |
| 317 | 0.08 | 2.00 | 0.045 | 0.030 | 0.75 | 18.0 - 20.0 | 11.0 - 15.0 | Mo 3.0-4.0, N 0.10 |
| 317L | 0.03 | 2.00 | 0.045 | 0.030 | 0.75 | 18.0 - 20.0 | 11.0 - 15.0 | Mo 3.0-4.0, N 0.10 |
| 321 | 0.08 | 2.00 | 0.045 | 0.030 | 0.75 | 17.0 - 19.0 | 9.0 - 12.0 | Ti 5(C+N) Min, 0.70 Max |
| 321H | 0.04 - 0.10 | 2.00 | 0.045 | 0.030 | 0.75 | 17.0 - 20.0 | 9.0 - 13.0 | — |
| 347 | 0.08 | 2.00 | 0.045 | 0.030 | 0.75 | 17.0 - 19.0 | 9.0 - 13.0 | Cb 10 x C Min, 1.0 Max |
| 347H | 0.04 - 0.10 | 2.00 | 0.040 | 0.030 | 1.00 | 17.0 - 20.0 | 9.0 - 13.0 | — |
| 904L | 0.02 | 2.00 | 0.045 | 0.030 | 1.00 | 19.0 - 23.0 | 23.0 - 28.0 | Mo 4.0-5.0, Cu 1.0-2.0 |
| 409L | 0.03 | 1.00 | 0.030 | 0.040 | 1.00 | 10.50 - 11.75 | 0.50 | Ti 6(C) Min - 0.75 Max, Cb 0.17 Max |
| 410 | 0.15 | 1.00 | 0.040 | 0.030 | 1.00 | 11.50 - 13.50 | 0.75 | — |
| 410S | 0.08 | 1.00 | 0.030 | 0.040 | 1.00 | 11.50 - 13.50 | 0.60 | — |
| 420 | 0.15 (Min) | 1.00 | 0.045 | 0.030 | 1.00 | 10.50 - 15.50 | 1.0 - 2.5 | Mo 0.20-1.20 |
| 430 | 0.12 | 1.00 | 0.030 | 0.040 | 1.00 | 16.0 - 18.0 | 0.75 | — |
Single figures are maximum limits unless the cell shows a range or is marked (Min). A dash means no value is shown for that element in the supplied reference.
Reference Notes
Values are reproduced from the supplied MBM material-chemistry reference.
Blank cells indicate no value shown in the supplied reference image.
All values are shown as weight percent unless otherwise stated.
Element Key
Important
For purchase orders, MTCs, QAPs and code compliance, verify chemistry
against the exact ASTM / ASME specification, grade and edition ordered.
This sheet is an engineering reference and not a substitute for the standard.
How to read the chart
Where a cell shows one number — 304 carbon at 0.08 — that is the upper limit. The element may be present at any level up to it.
18.0 – 20.0 chromium means the heat must fall inside that band, both ends inclusive.
Grade 420 carbon reads 0.15 (Min): the element must be at least that figure, with no upper limit shown here.
No value is shown against that element in the supplied reference. It is not a declaration that the element is absent.
What the suffixes mean
304L and 316L cap carbon at 0.03 against 0.08 for the base grade, which limits carbide precipitation at the weld.
304H, 316H, 321H and 347H hold carbon in a 0.04 – 0.10 band for creep strength in elevated-temperature service.
321 and 316Ti carry Ti at 5(C+N) minimum, 0.70 maximum, so titanium ties up carbon ahead of chromium.
347 carries Cb at 10 × C minimum, 1.0 maximum — the same idea using columbium (niobium) instead.
Products we manufacture in these grades
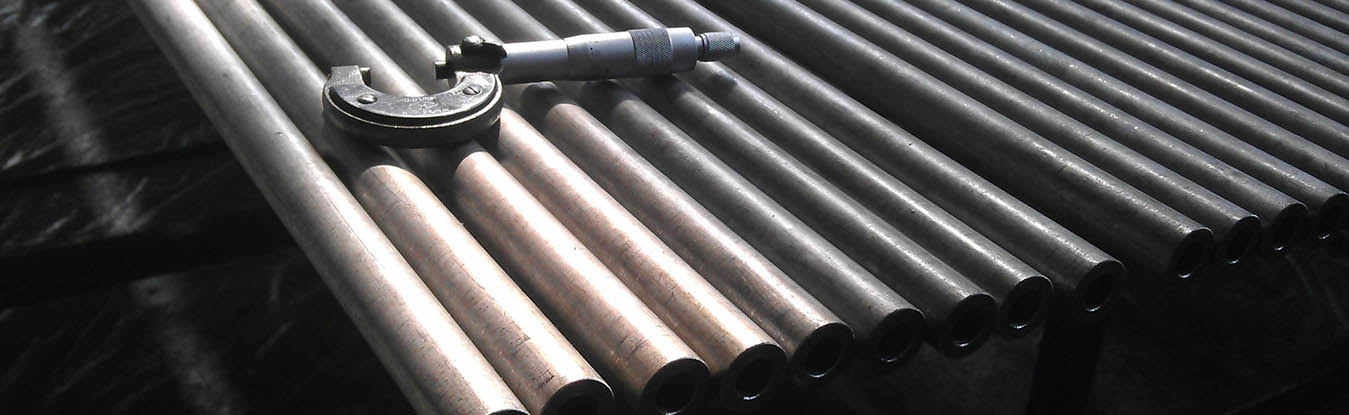
Cold drawn and pilgered seamless stainless steel.
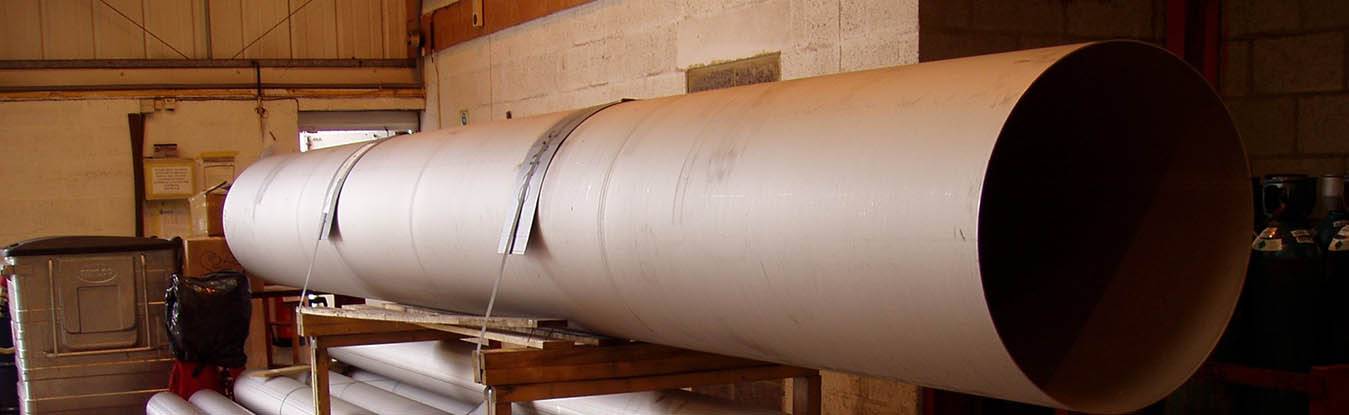
TIG welded in a full range of grades and finishes.
Exchanger and condenser duty in 304, 316, 321 and duplex.
Chemistry and mechanical results supplied with every heat.
Need a size not listed?
MBM Tubes manufactures stainless steel seamless and welded tubes in various grades, sizes, gauges and specifications as per customer requirements.
Send your requirement WhatsApp MBMFrequently Asked Questions
Are the values in this chart weight percent?
Yes. All values are shown as weight percent unless otherwise stated, which is how chemistry is reported on a mill test certificate.
What does a blank cell mean?
A blank cell — shown as a dash in the chart — means no value is given for that element in the supplied reference. It does not mean the element is absent from the grade, so check the governing specification for those figures.
What is the difference between 304 and 304L?
Carbon. 304 allows up to 0.08 % while 304L is capped at 0.03 %. The rest of the chemistry is the same band, and the lower carbon of 304L reduces sensitisation in the weld heat-affected zone.
Why do 304H, 316H, 321H and 347H show a carbon range?
The H grades hold carbon between 0.04 and 0.10 % rather than simply capping it. The carbon is wanted, because it is what gives these grades their creep strength in elevated-temperature service.
What are the stabilising elements in 321, 347 and 316Ti?
321 and 316Ti use titanium at 5(C+N) minimum and 0.70 maximum; 347 uses columbium at 10 × C minimum and 1.0 maximum. Both tie up carbon so it cannot combine with chromium at the grain boundary.
Can I use this chart for a purchase order or a QAP?
Treat it as an engineering reference only. For purchase orders, MTCs, QAPs and code compliance, verify the chemistry against the exact ASTM / ASME specification, grade and edition you have ordered — this sheet is not a substitute for the standard.

Products Category
Available Material
Footer Navigation
Copyright © 2026 MBM TUBES. All rights reserved. | Disclaimer | Blogs
Design & Promoted by www.rathinfotech.com